We believe in data, math, and money
WNBA all time accuracy: 65.8%
NBA all time accuracy: 67.5%
Margin of Error: 1.5%
Read more
How does our prediction model work?
We use the Elo-rating system, which comes from game theory, to predict game results. Each team has an Elo-rating score. The higher the score, the better the team. Teams lose or gain points after a loss or win. The first application used in basketball was given by fivethirtyeight from ABC. But its first application in sports was at football in 2010.
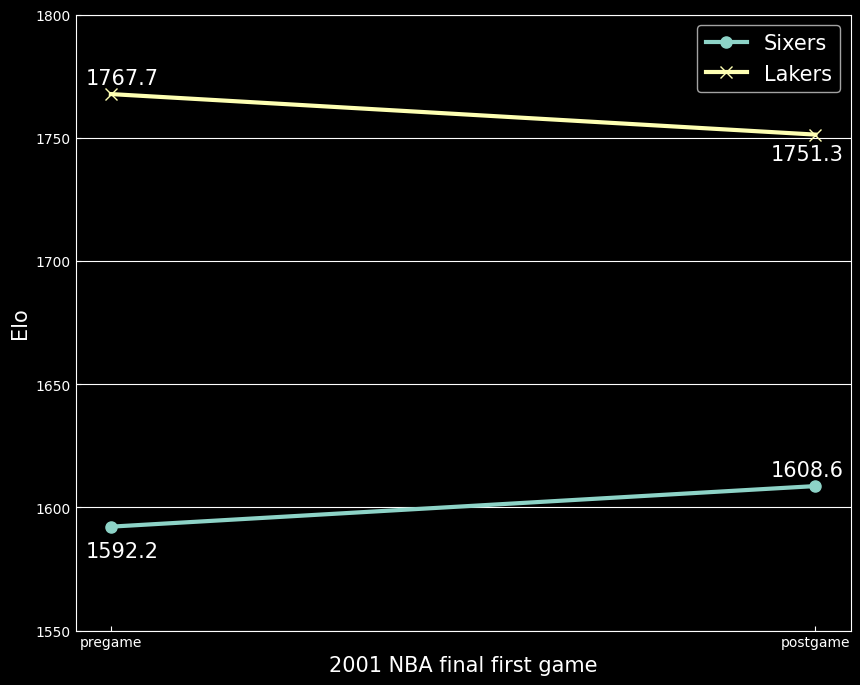
For example, the right figure shows how the rating changes after the first game of the 2001 NBA final: Philadelphia 76ers won over Los Angeles Lakers. They gained 16.4 points, which is the same amount that Lakers lost.
We give all the teams the same points at the very beginning of the league (1300 for NBA in 1946 and 1500 for WNBA in 1997.) After a few games, the ratings will start to show how a team really performs. So the rating can be a solid indicator of the strength of each team. Hence, it is also a good indicator for predicting game results. If you are interested in the details, you can check it out on FiveThirtyEight or contact us.
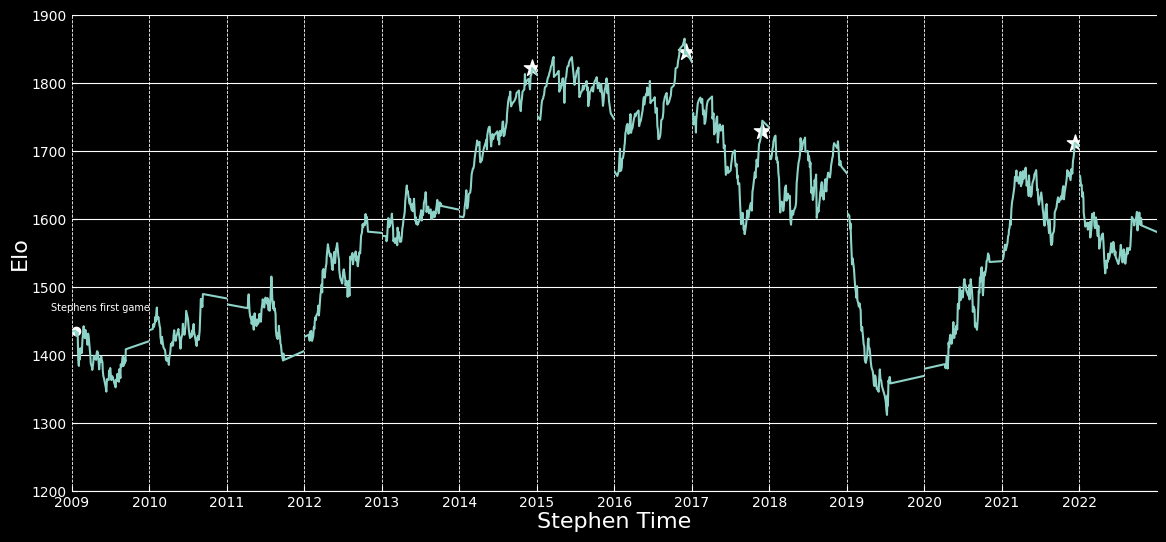
The above plot shows how the Golden State Warriors’ Elo-rating changed after Stephen Curry joined them in the 09-10 season. The four stars stand for their four championships. We can see from the plot that in the 16-17 season, the team’s rating peaked at 1846 points at the finals.
How accurate is our model?
From the first game from 1946 to the end of 23-24 NBA season. Our model has an overall 67.5% accuracy for NBA and 65.8% for WNBA. It correctly predicts 50, 581 NBA games out of the total 74, 895 games. You can download the excel and review every single game of our predictions for both NBA and WNBA.
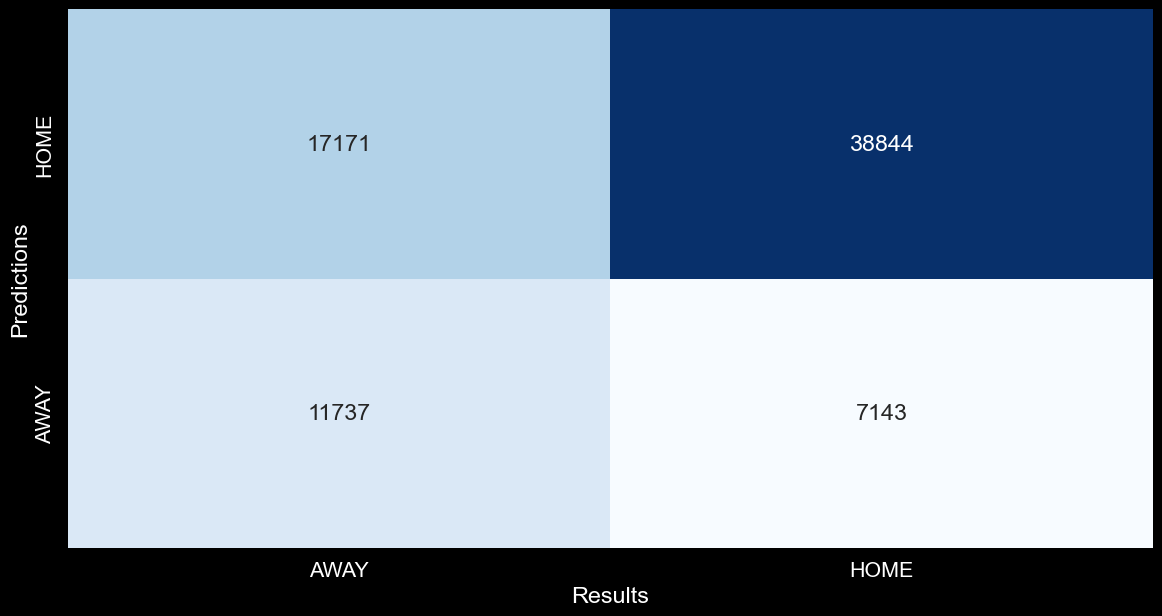
The right matrix shows the predicted results for home and away teams. The y-axis shows the predicted results while the x-axis shows the real results. When predicting the home team win, our model reached an accuracy of 69.3% (38844 out of 56015).
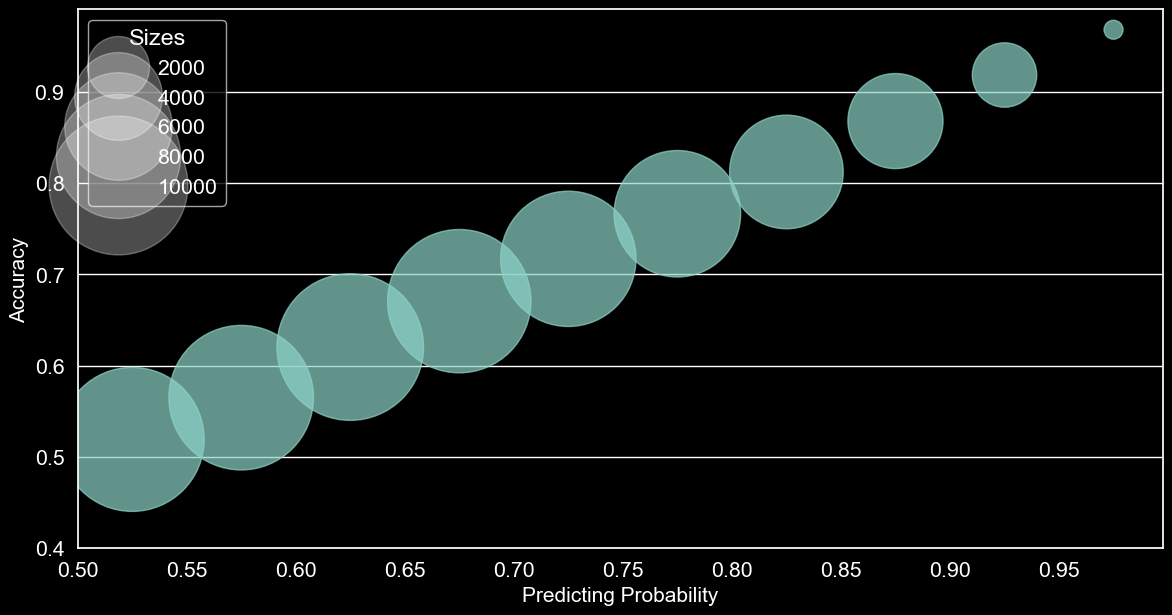
The left scatter plot shows the corresponding accuracy at the given predicted win probability:
All predicting win probabilities are divided into 10 sets starting from 50% to 100% with step 5%. The y-axis stands for the accuracy of each set and the size of each spot stands for the size of each set: the larger the spot, the more games are in that set. Basically, we can find that the two axes have a very nice R-squared value.
How do our betting strategies work?
First, we need to make sure a bet makes sense. In other words, the expected return of a bet should be larger than the stake.
Let’s say you put one dollar into a coin flipping game, you’ll get two dollars if you get the head and lose the wager if it’s the tail. If it’s a fair coin, then in this situation your expected return is zero since when you win, the two dollar return has one dollar of stake in it, so you actually only win one dollar, which is the same amount as when you lose.
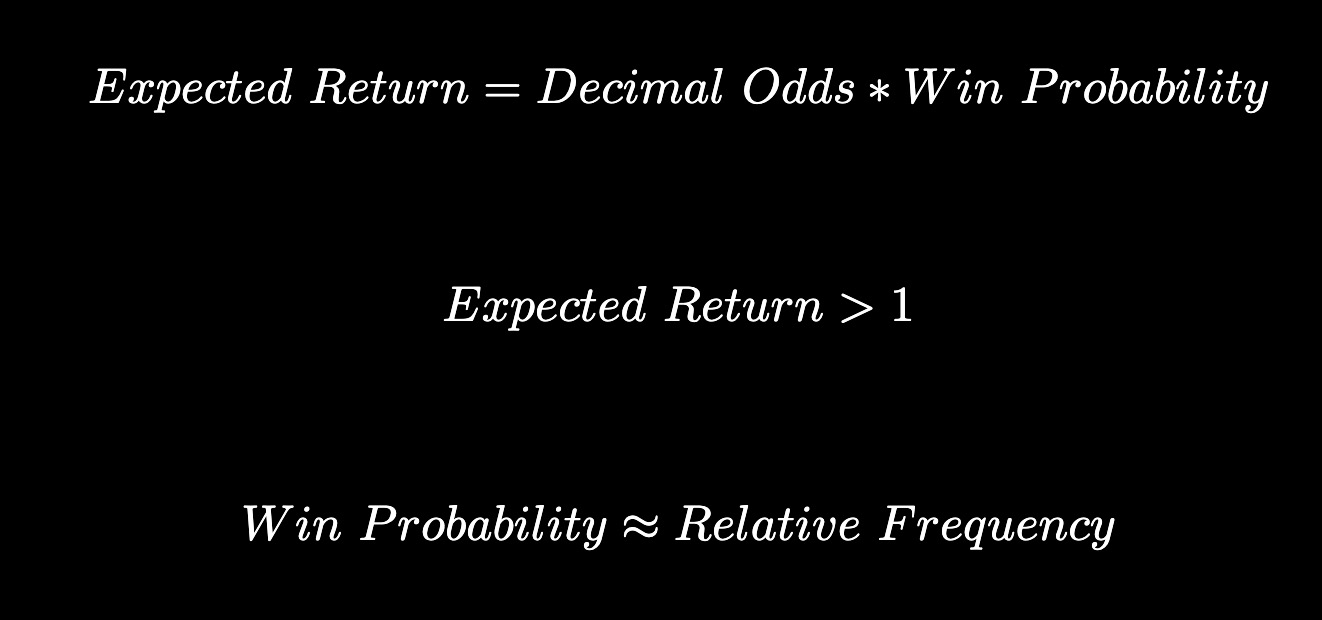
With the knowledge of how to make a bet, we can now conclude as follows:
- We should find bookmakers that provide good odds
- We should improve our win probability
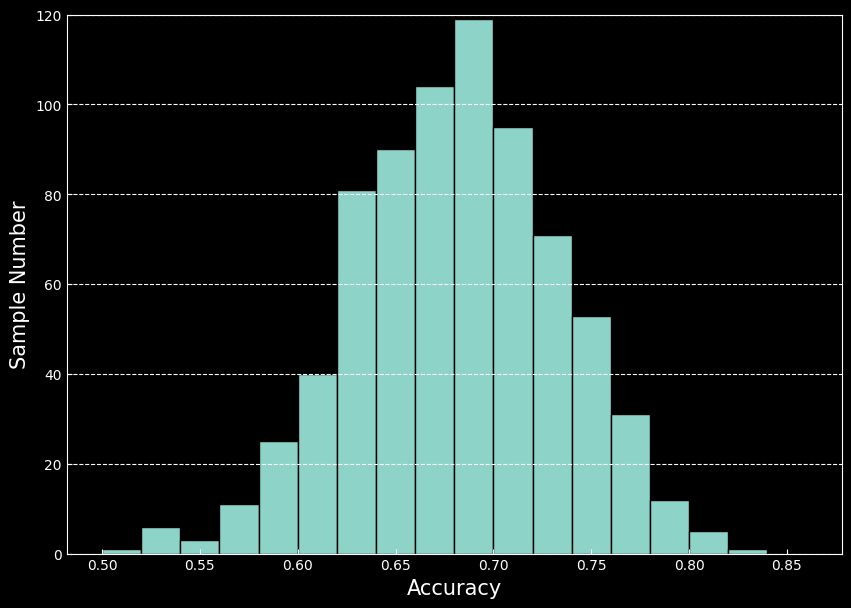
There is a caveat: any probability other than 1 or 0 has volatility: in a relatively short time period, the win probability could divert from the true rate. But we can calculate the 95% confidence interval, which means that 95% of the time, your win probability falls within this interval.
The left figure shows that the accuracy distributes normally. Each sample includes 100 games from 1946.
Coming next
Even more accurate predicting models based on players’ performance
predicting models for DOTA 2 teams